
The Credit Signal: Live JOJO.Index Tracker
Live tracker for the JOJO.Index credit signal: current regime (credit-off), spreads, and every stress episode since 2007.
Last regime change: week ending 2026-10-23. Data through 2026-10-28. Updated every trading day.
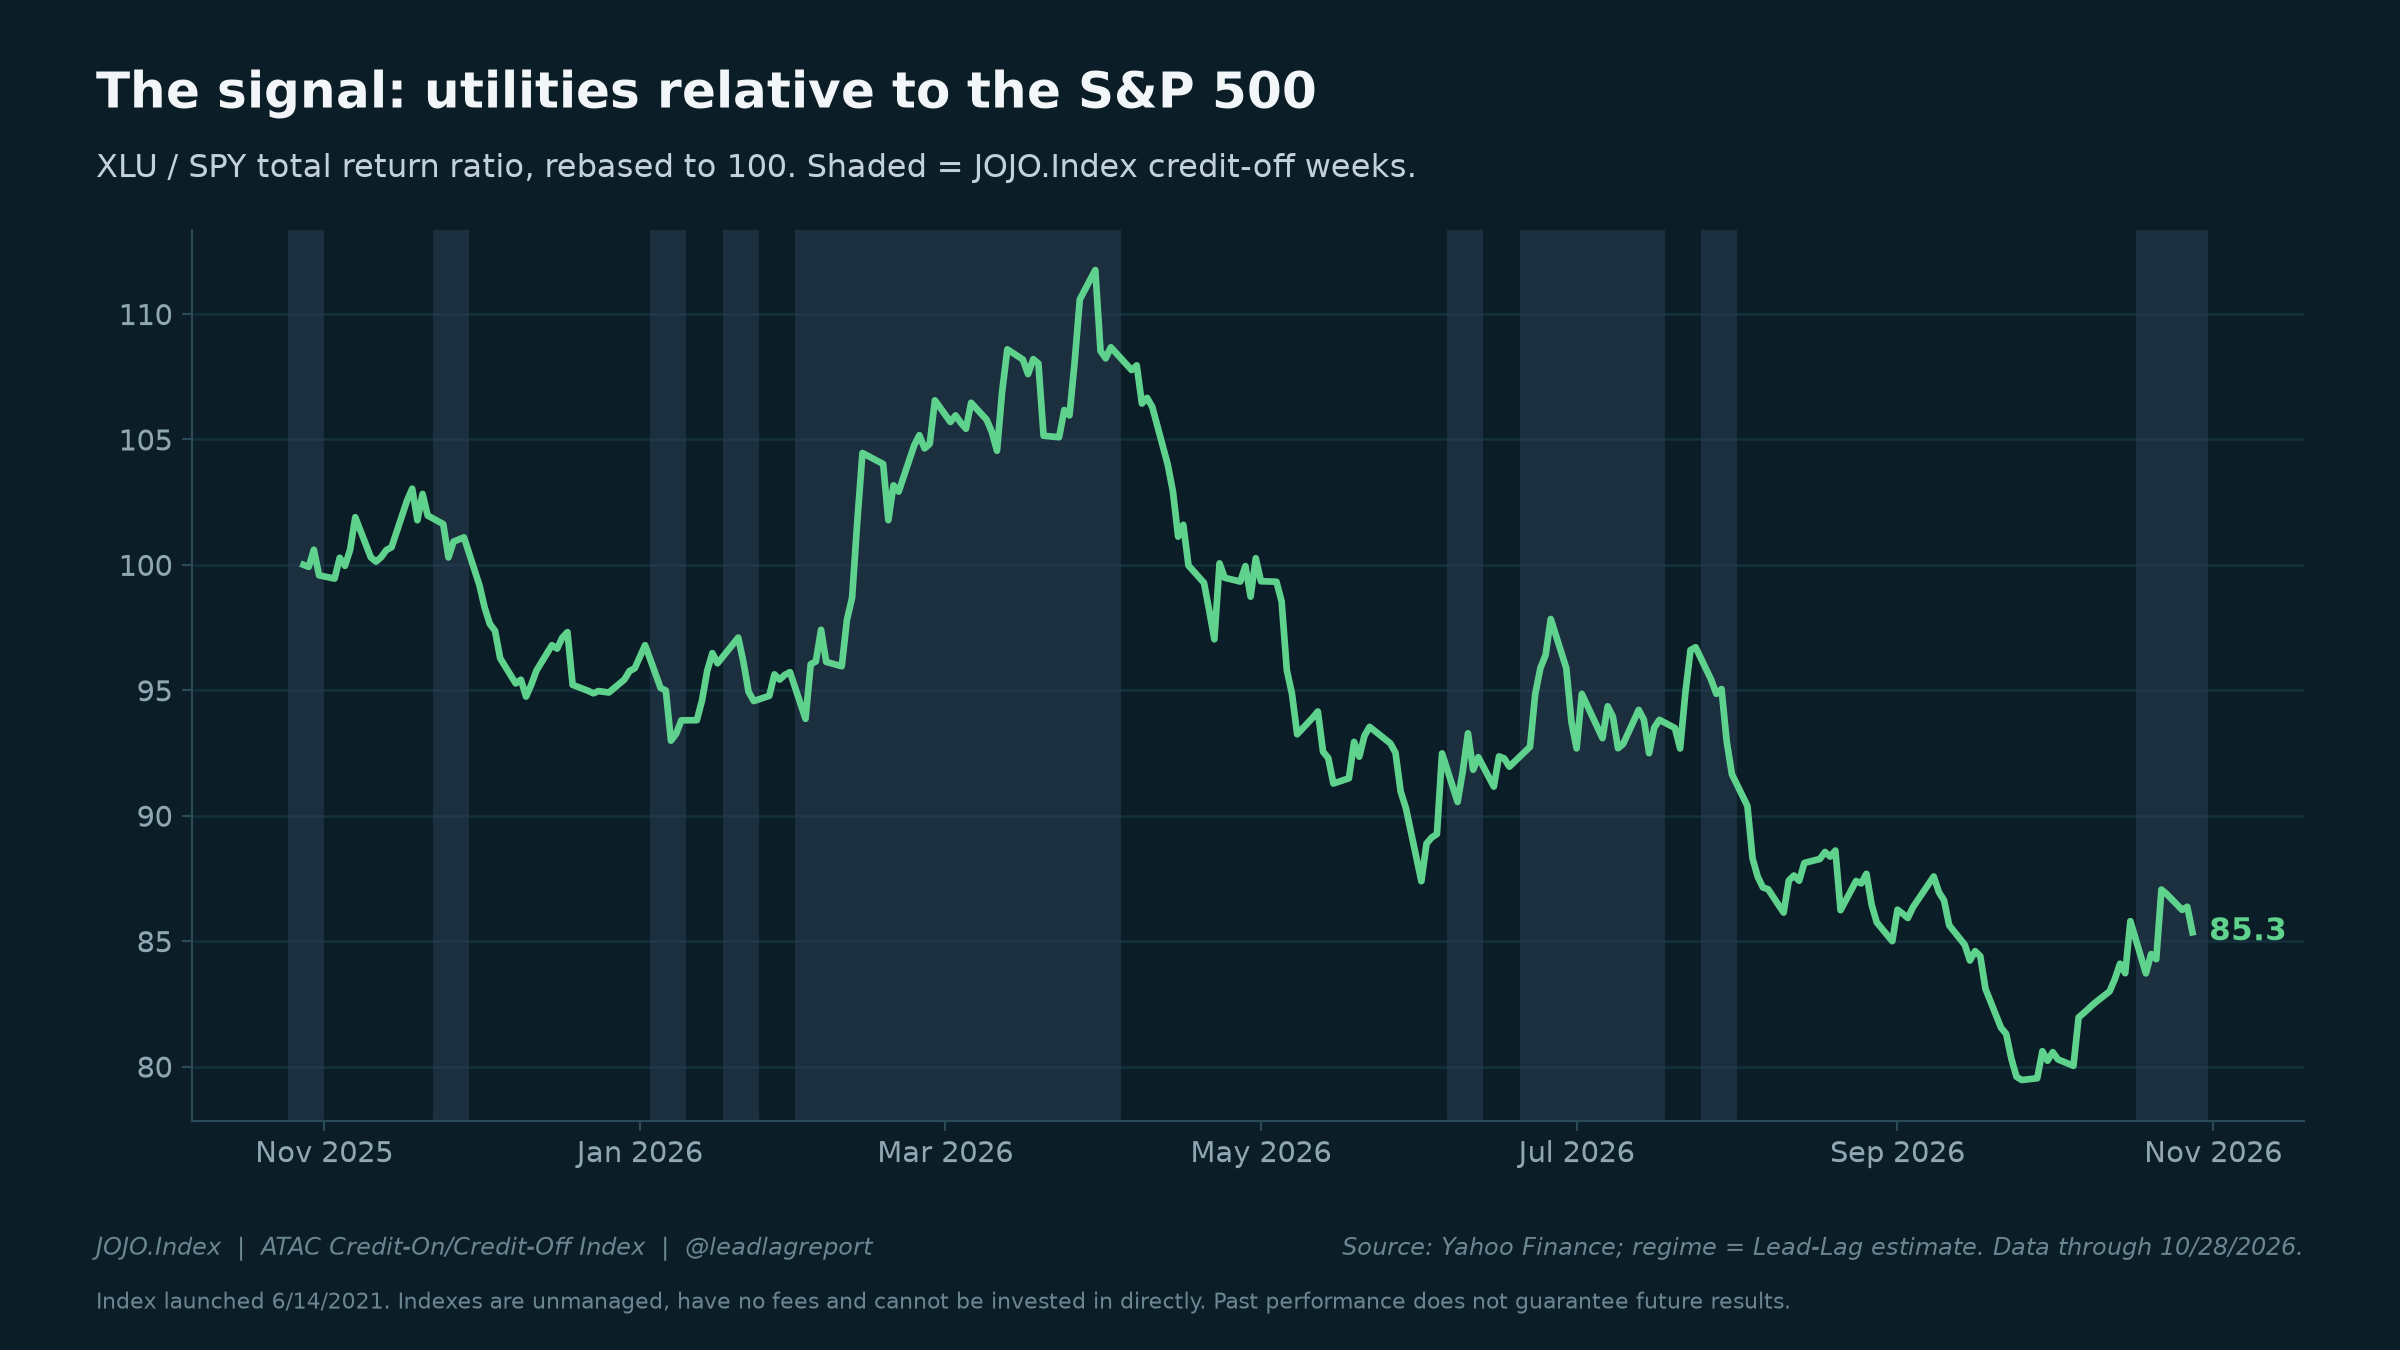
The JOJO.Index (ATAC Credit-On/Credit-Off Index) asks one question every week: are utilities leading the S&P 500? When they are, it rotates out of high yield and into long Treasuries. When they are not, it holds high yield. This page tracks that signal, the credit market it is reacting to, and how the index has behaved in every major stress episode since 2007.
The signal right now
Utilities vs. the S&P 500 over the past 4 weeks: +6.38%. The index has changed regime 81 times since its June 2021 launch and has been credit-off in 47.0% of weeks.
Credit spreads
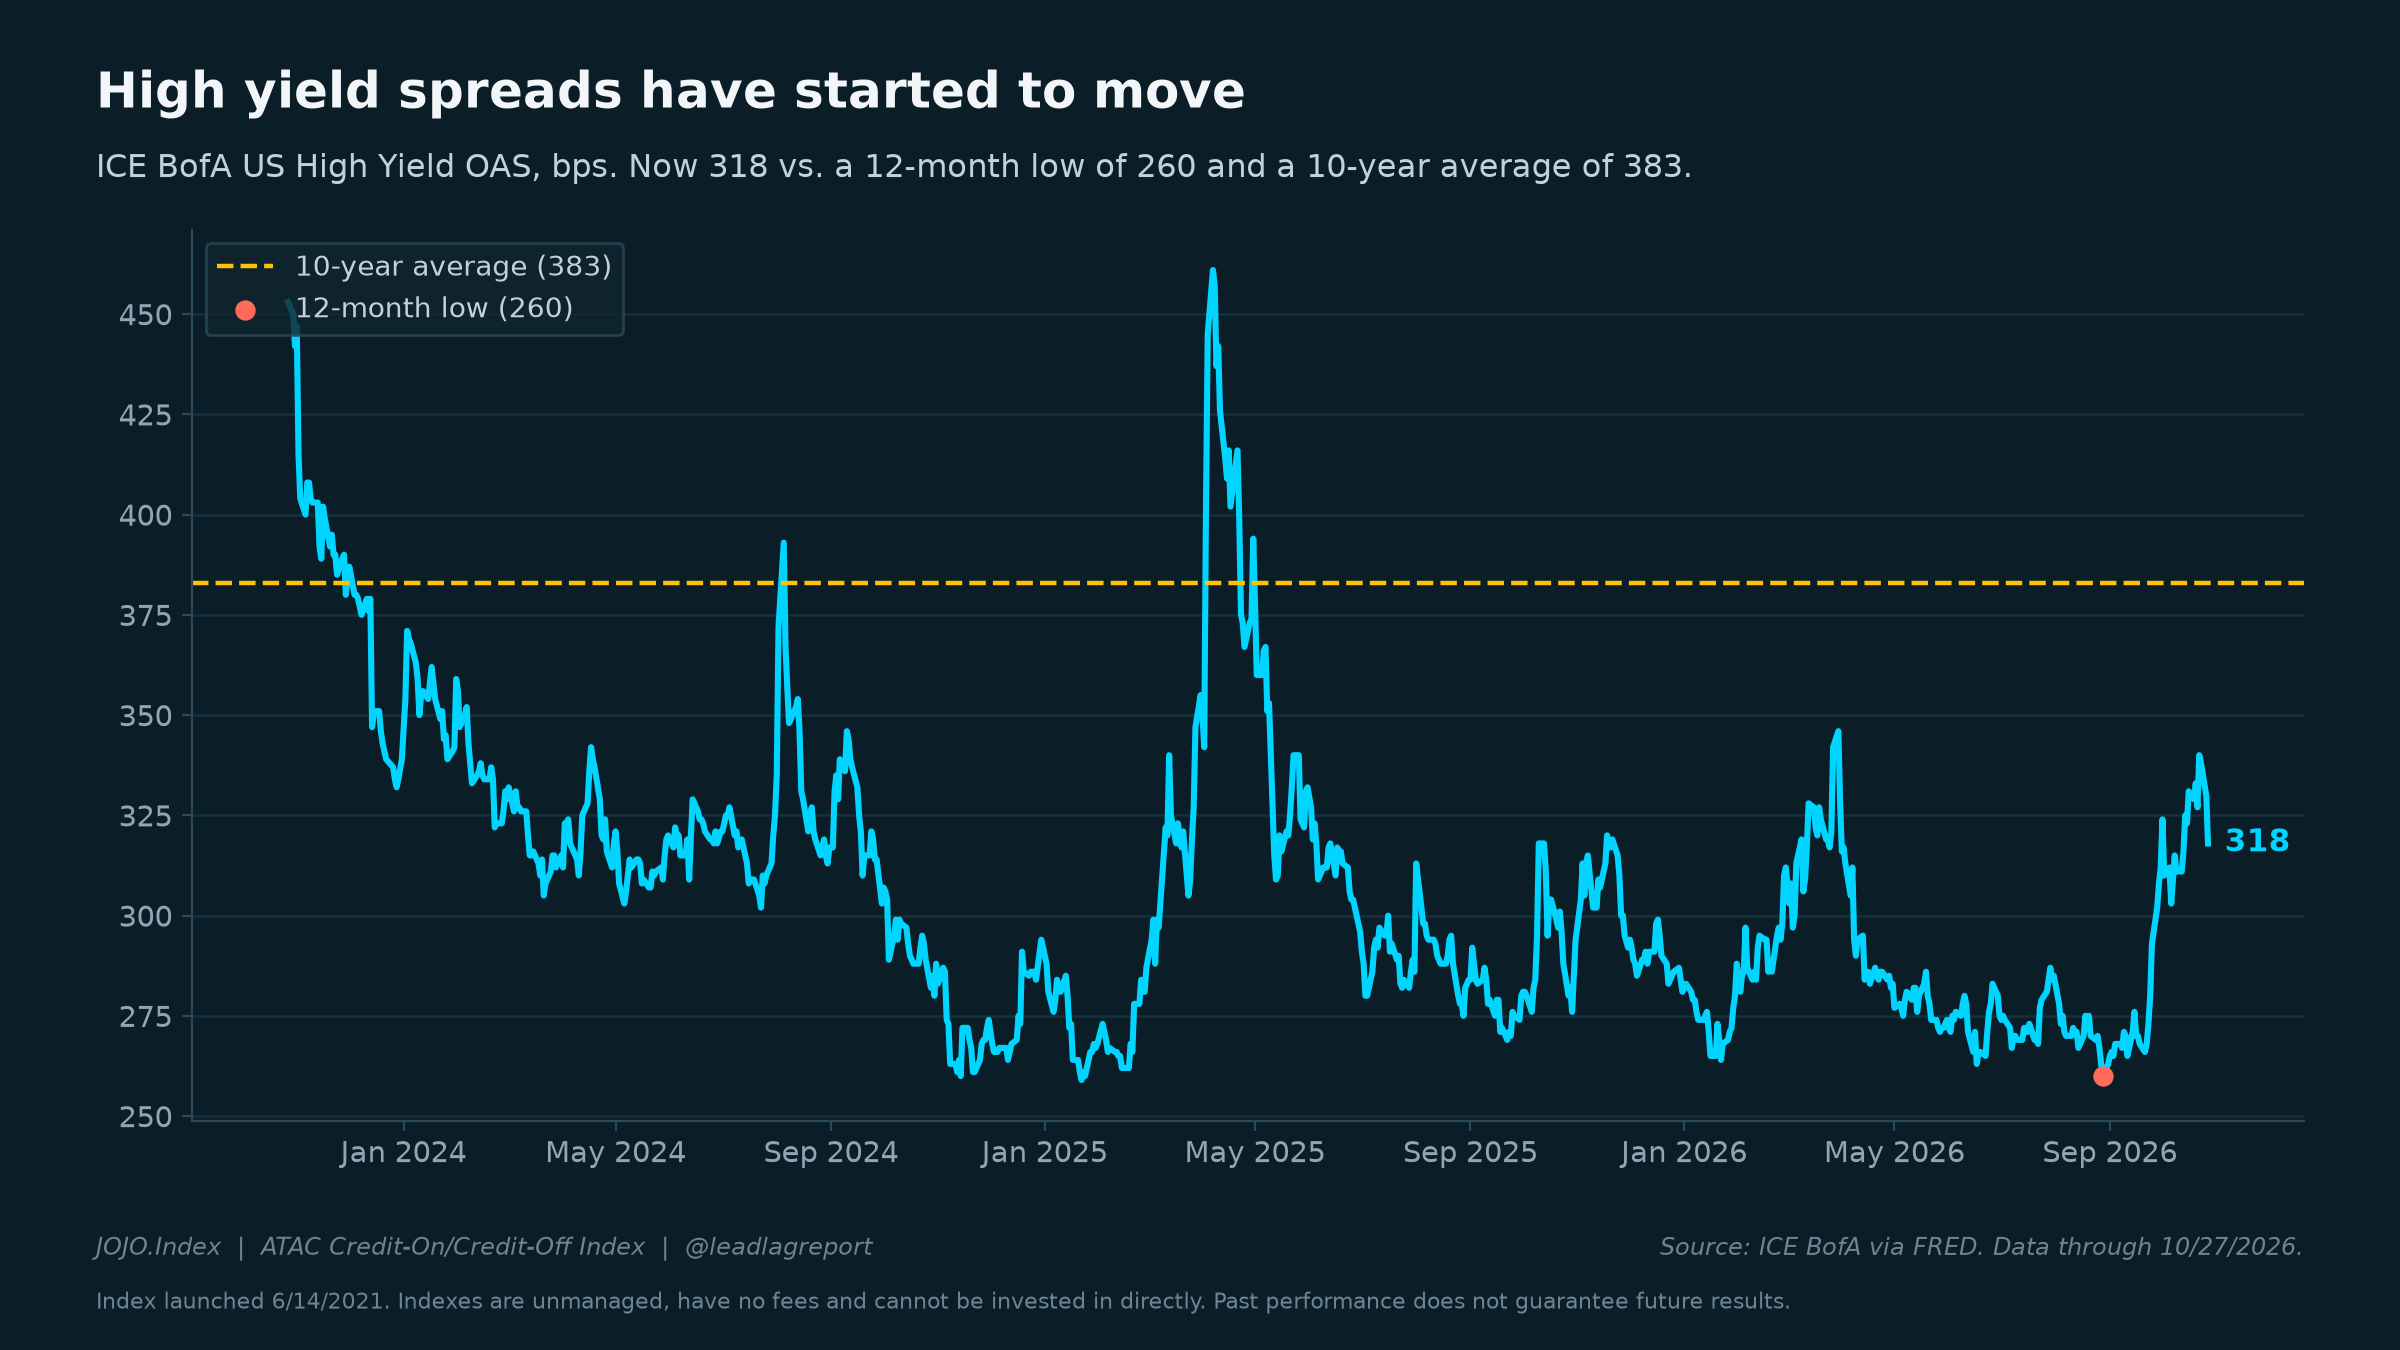
High yield spreads were 318 bps on 2026-10-27, against a 12-month low of 260 bps (2026-08-28) and a 10-year average of 383 bps. That is roughly the 17th percentile of readings since 1997. Investment grade: 88 bps.
Every stress episode since 2007
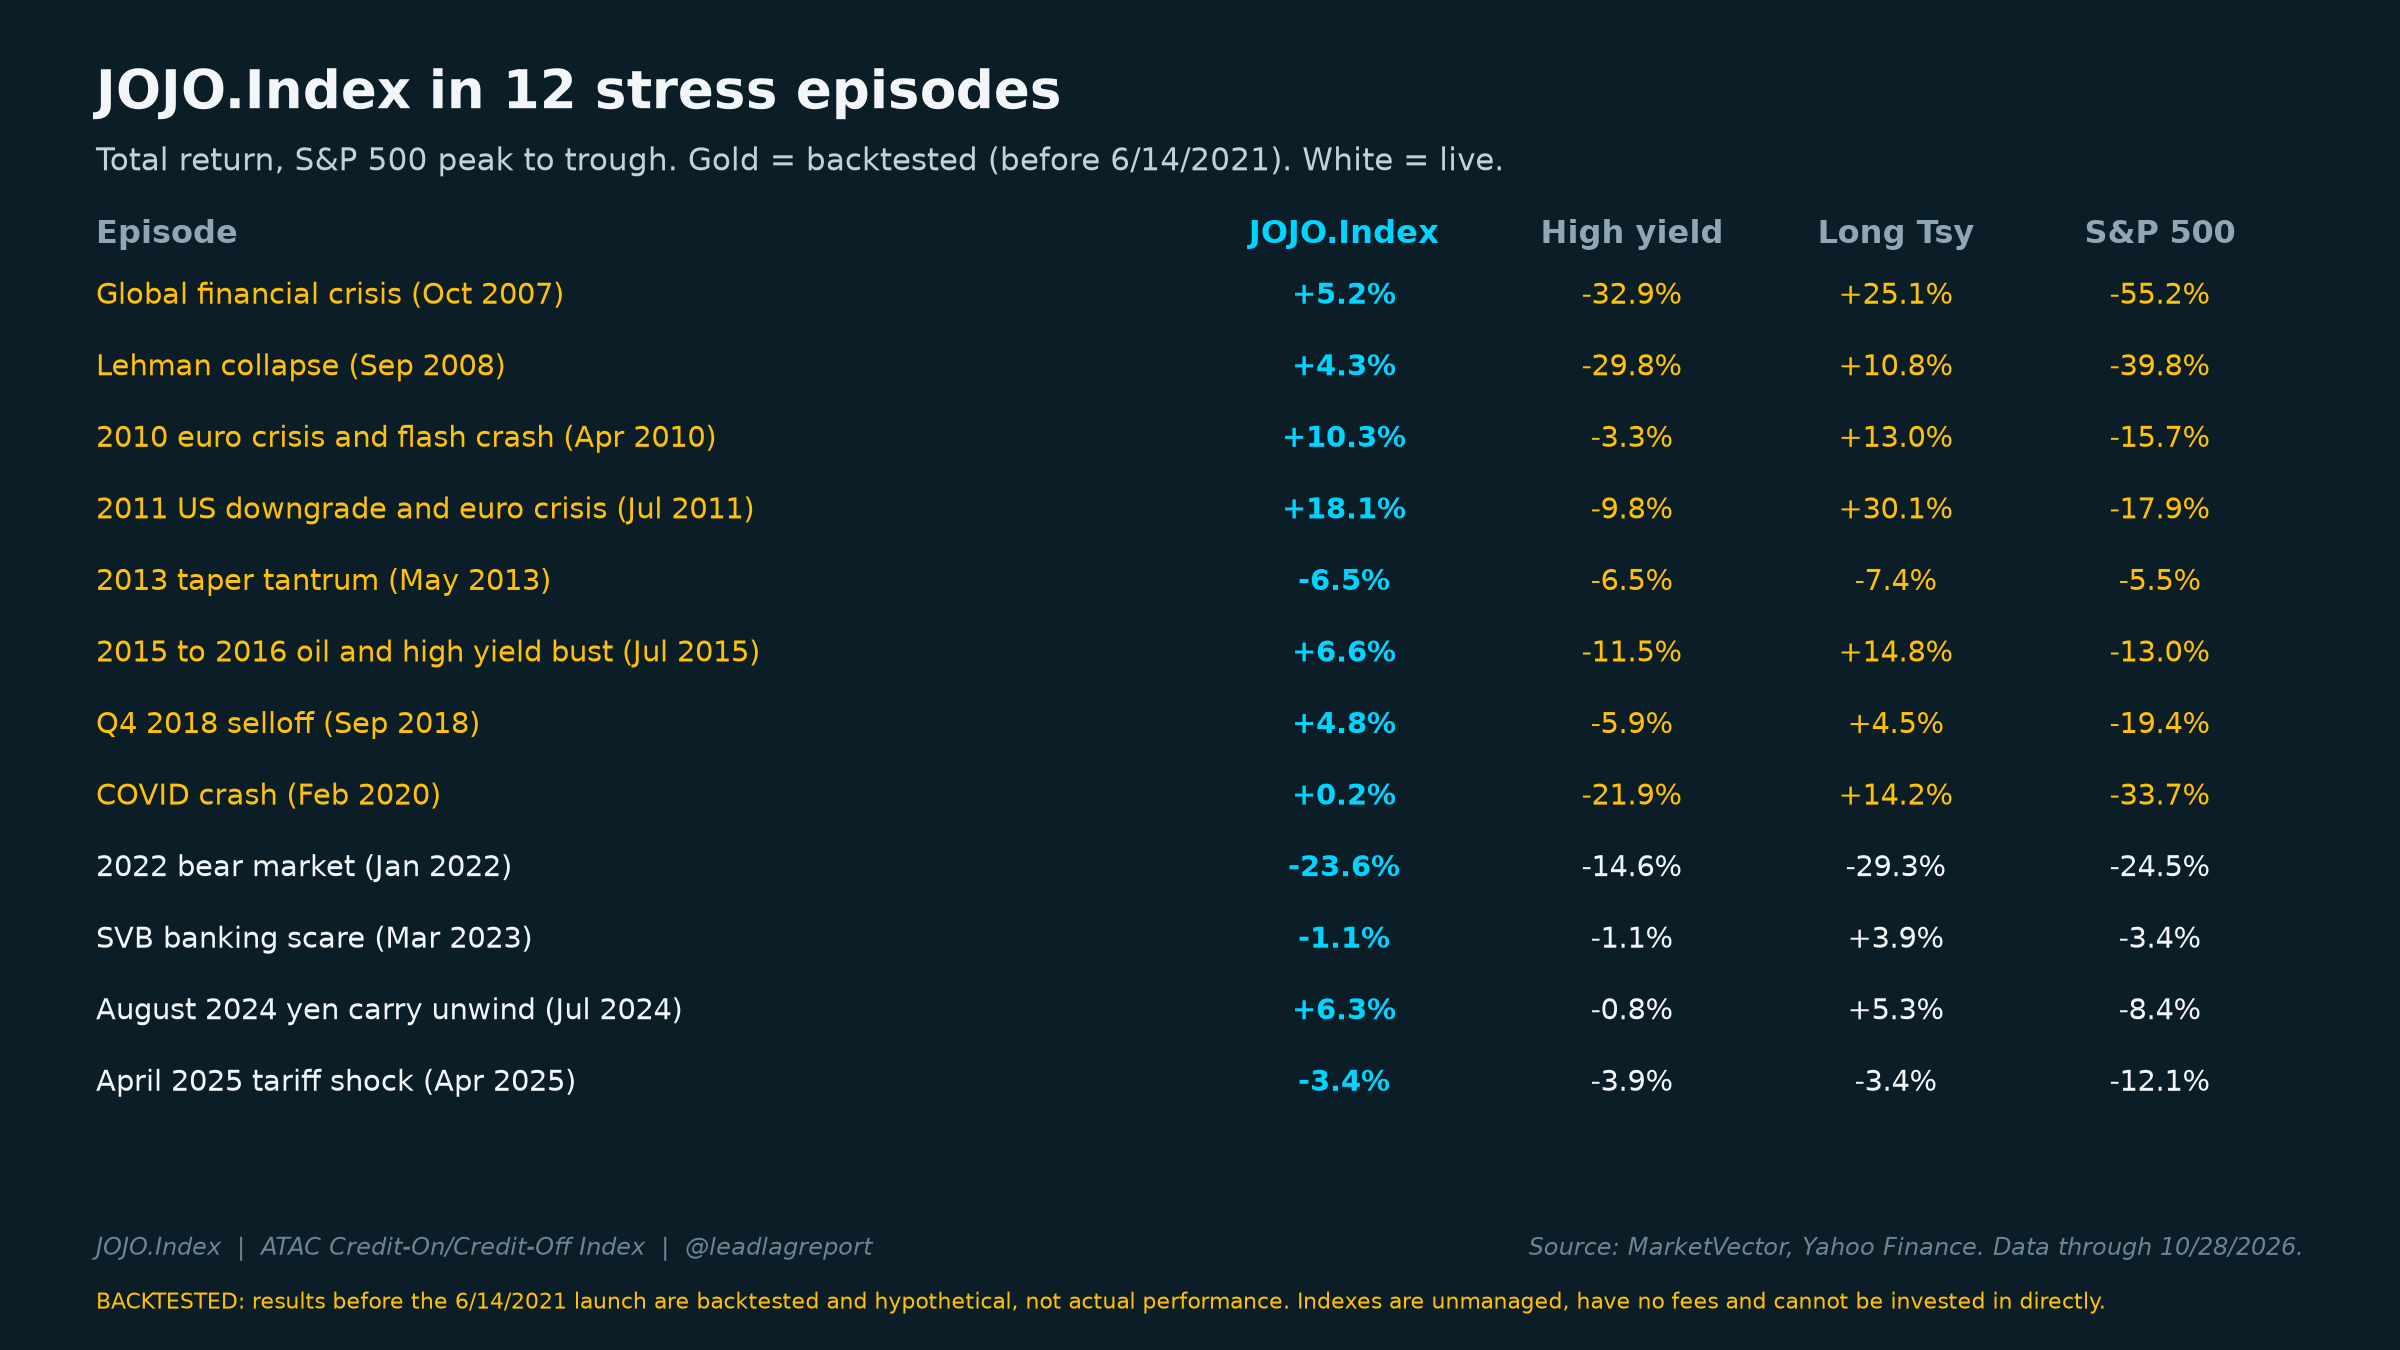
Total return from the S&P 500 peak to its trough in each episode. Episodes before the 6/14/2021 launch are backtested and hypothetical. The misses are included.
| Episode | Window | JOJO.Index | High yield | S&P 500 | Credit-off weeks |
|---|---|---|---|---|---|
| Global financial crisis (backtested) | 2007-10-09 to 2009-03-09 | +5.19% | -32.87% | -55.19% | 44 of 75 |
| Lehman collapse (backtested) | 2008-09-12 to 2008-11-20 | +4.27% | -29.83% | -39.82% | 9 of 11 |
| 2010 euro crisis and flash crash (backtested) | 2010-04-23 to 2010-07-02 | +10.28% | -3.32% | -15.70% | 9 of 11 |
| 2011 US downgrade and euro crisis (backtested) | 2011-07-22 to 2011-10-03 | +18.09% | -9.78% | -17.89% | 8 of 12 |
| 2013 taper tantrum (backtested) | 2013-05-21 to 2013-06-24 | -6.52% | -6.52% | -5.55% | 0 of 6 |
| 2015 to 2016 oil and high yield bust (backtested) | 2015-07-20 to 2016-02-11 | +6.64% | -11.47% | -13.02% | 18 of 30 |
| Q4 2018 selloff (backtested) | 2018-09-20 to 2018-12-24 | +4.78% | -5.90% | -19.35% | 10 of 15 |
| COVID crash (backtested) | 2020-02-19 to 2020-03-23 | +0.23% | -21.90% | -33.72% | 4 of 6 |
| 2022 bear market | 2022-01-03 to 2022-10-12 | -23.64% | -14.56% | -24.50% | 29 of 41 |
| SVB banking scare | 2023-03-08 to 2023-03-13 | -1.08% | -1.08% | -3.40% | 0 of 2 |
| August 2024 yen carry unwind | 2024-07-16 to 2024-08-05 | +6.26% | -0.85% | -8.41% | 3 of 4 |
| April 2025 tariff shock | 2025-04-02 to 2025-04-08 | -3.37% | -3.93% | -12.05% | 2 of 2 |
The long view
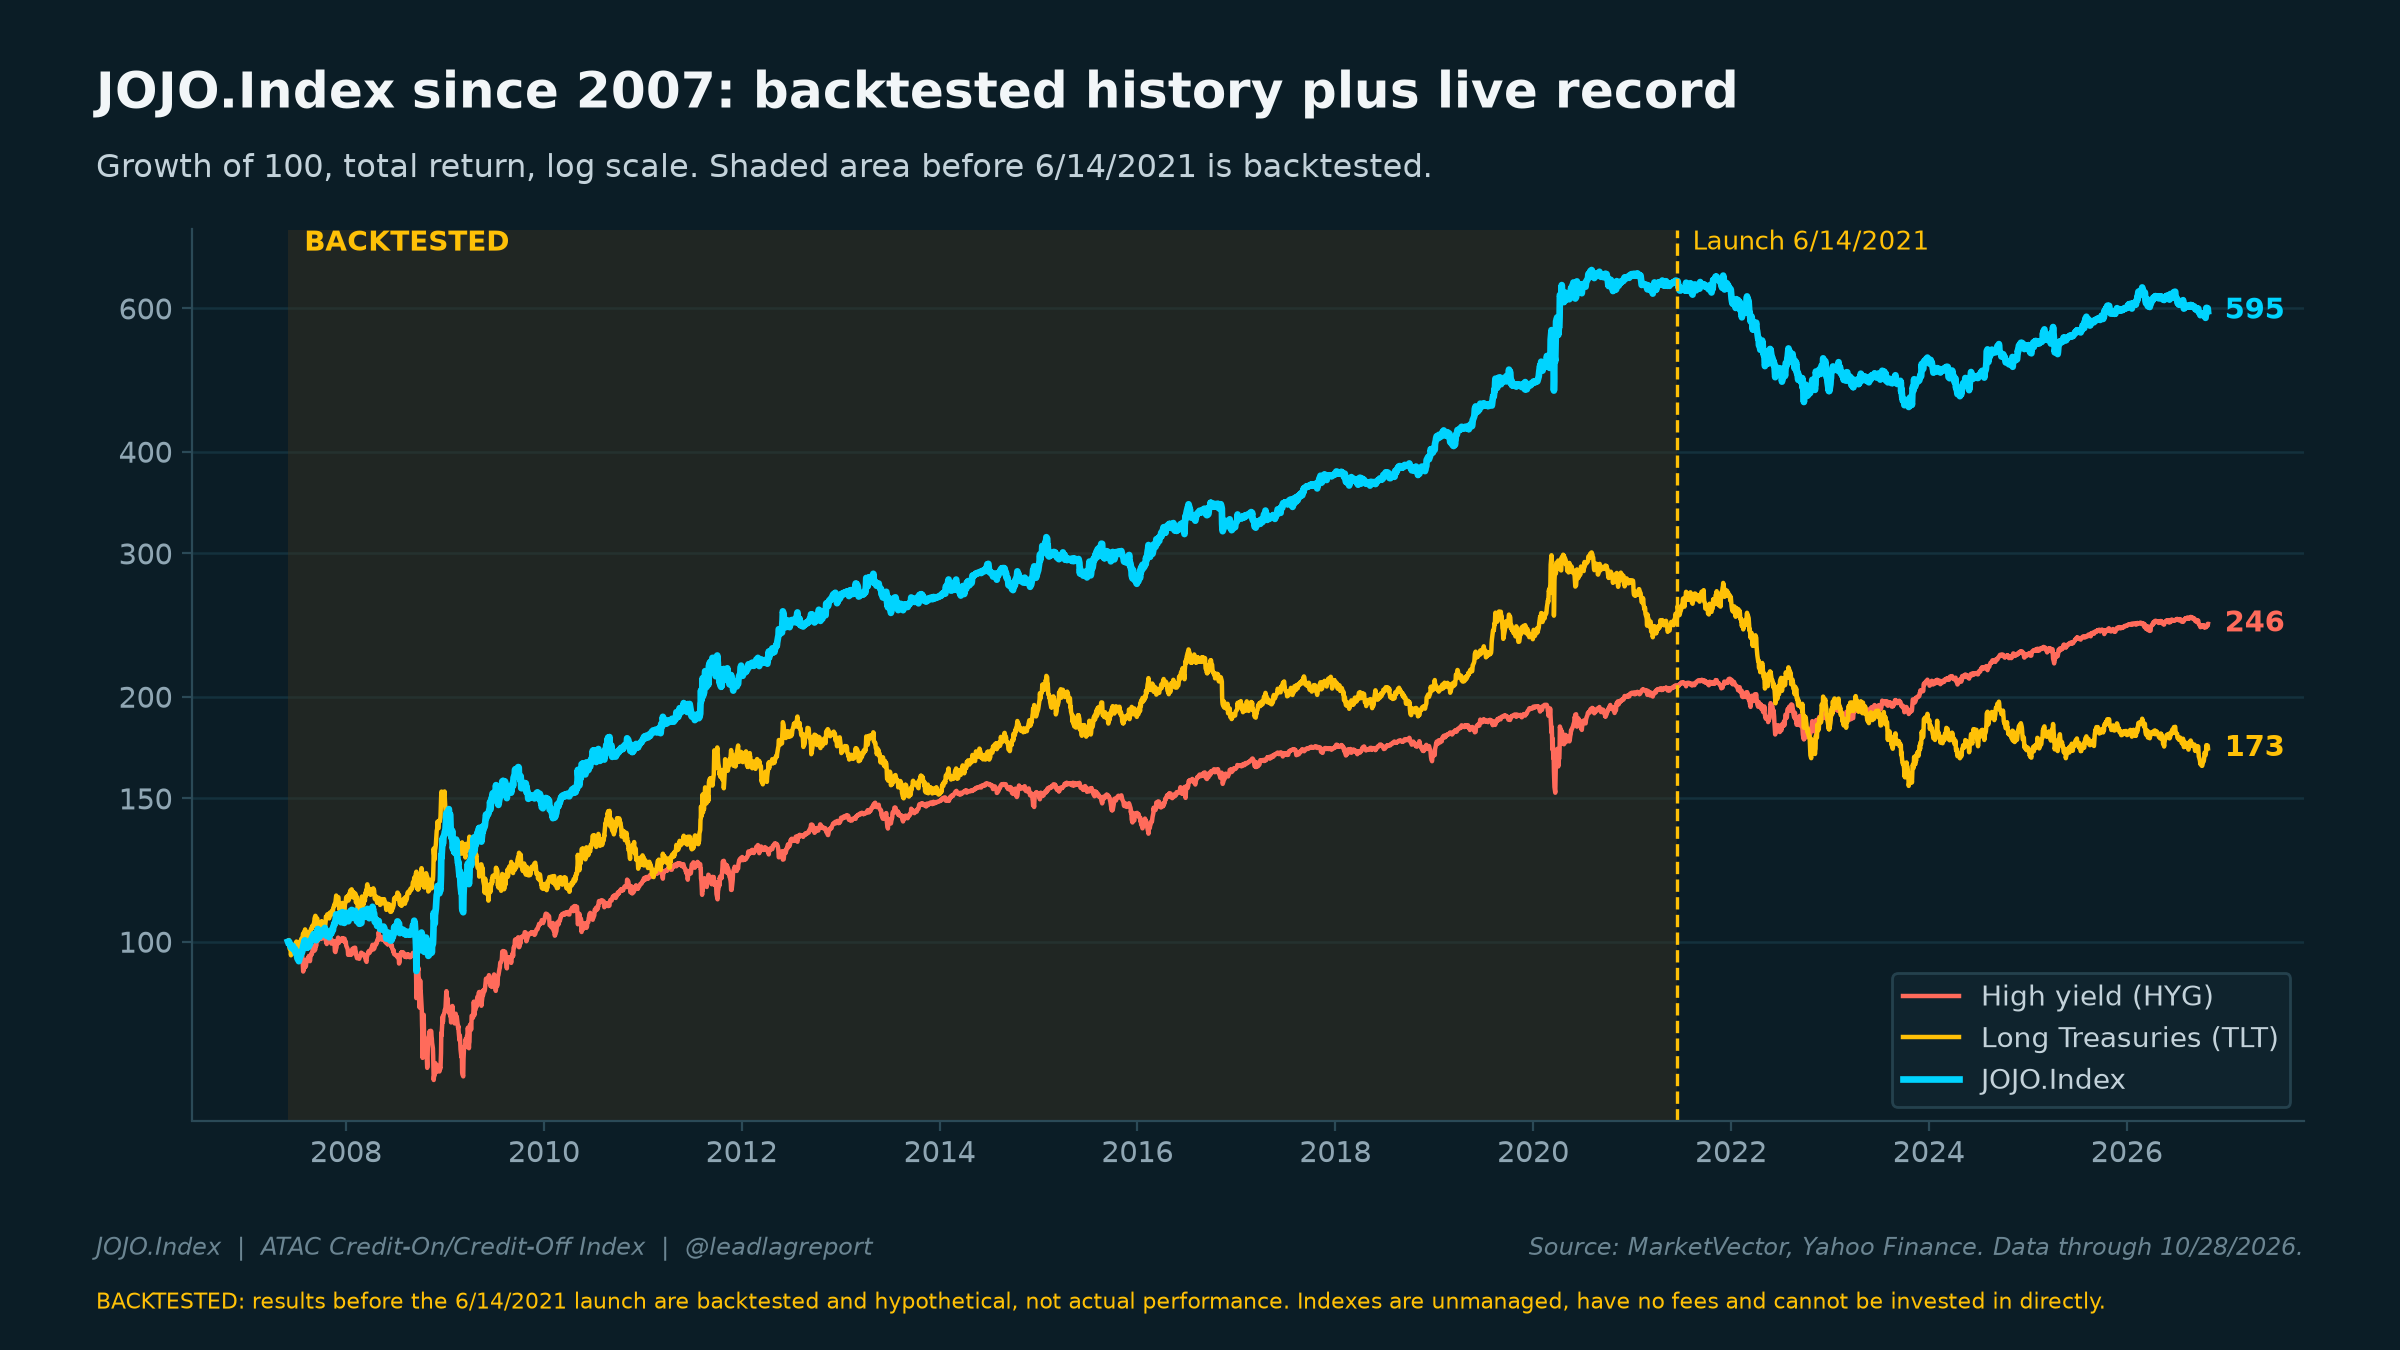
Since 2007, backtested history plus the live record: 9.63% a year, against 4.74% for high yield and 2.86% for long Treasuries. The live years since 2021 have been harder than the backtest, mainly because 2022 hit long Treasuries harder than high yield.
The live scorecard
| Period | JOJO.Index | High yield | Long Treasuries |
|---|---|---|---|
| 1W | +0.93% | +0.79% | +0.93% |
| 1M | +0.73% | +0.51% | +3.43% |
| 3M | -3.05% | -0.85% | -2.71% |
| YTD | -0.86% | +0.60% | -3.84% |
| 1Y | -1.49% | +1.34% | -7.90% |
| 3Y | +29.14% | +28.02% | +9.09% |
| since launch | -8.19% | +19.09% | -31.05% |
Get the free Crisis File and the Monday signal
Free subscribers to The Lead-Lag Report get The Credit Signal Crisis File (a 7-page PDF covering all 12 stress episodes, the charts and the honest misses) plus The Credit Signal email every Monday. Subscribe free and the download appears right here.
The JOJO.Index is the ATAC Credit-On/Credit-Off Index, administered by MarketVector, launched 6/14/2021. Results before launch are backtested and hypothetical, not actual performance, and were constructed with the benefit of hindsight. Indexes are unmanaged, have no fees and cannot be invested in directly. Past performance does not guarantee future results. Regime history is a Lead-Lag estimate from daily index returns. Sources: MarketVector, Yahoo Finance, ICE BofA via FRED. This page is for research and information only and is not investment advice or an offer of any security.